









Skip to content

Feature · Statistics

Detailed statistics for your events

Dashboards, exports, and key indicators

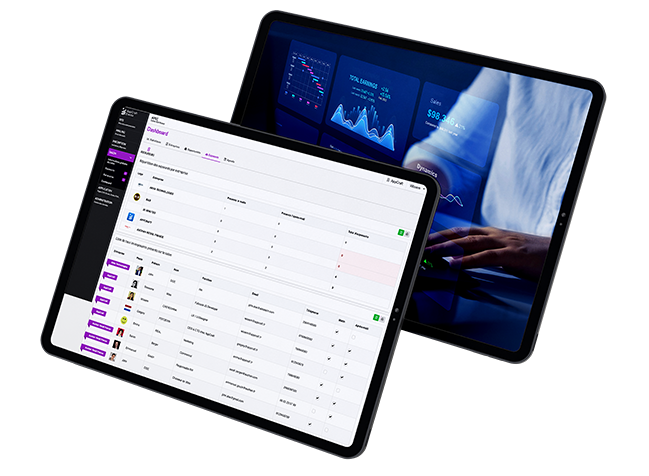
Two tablets displaying professional software interfaces: the tablet in the foreground shows a data or user management dashboard, and the one in the background displays financial analysis or sales charts.

SmartHub: manage your event using data

Centralize your key indicators and collaborate in real time with your service providers thanks to intelligent and secure reports.

Monitor your events in real time and understand your attendees. Our platform collects all the data you need to build a qualified contact base, measure satisfaction, and calculate ROI and NPS. All reports are now accessible through an OTP (One-Time Password) secured link, ensuring individual, protected access.

No more outdated Excel exports and endless emails. With our SmartHub, you see your event's performance live (registrations, attendance, engagement). Better still: create and share custom views for your clients or operations teams, accessible through a simple secure link and always up to date. Shared reports refresh dynamically every 30 seconds: no data "freeze", always the latest version.

We explain everything about our event statistics

The SmartHub and Dashboard Customization

SmartHub: Tailor-made global statistics.

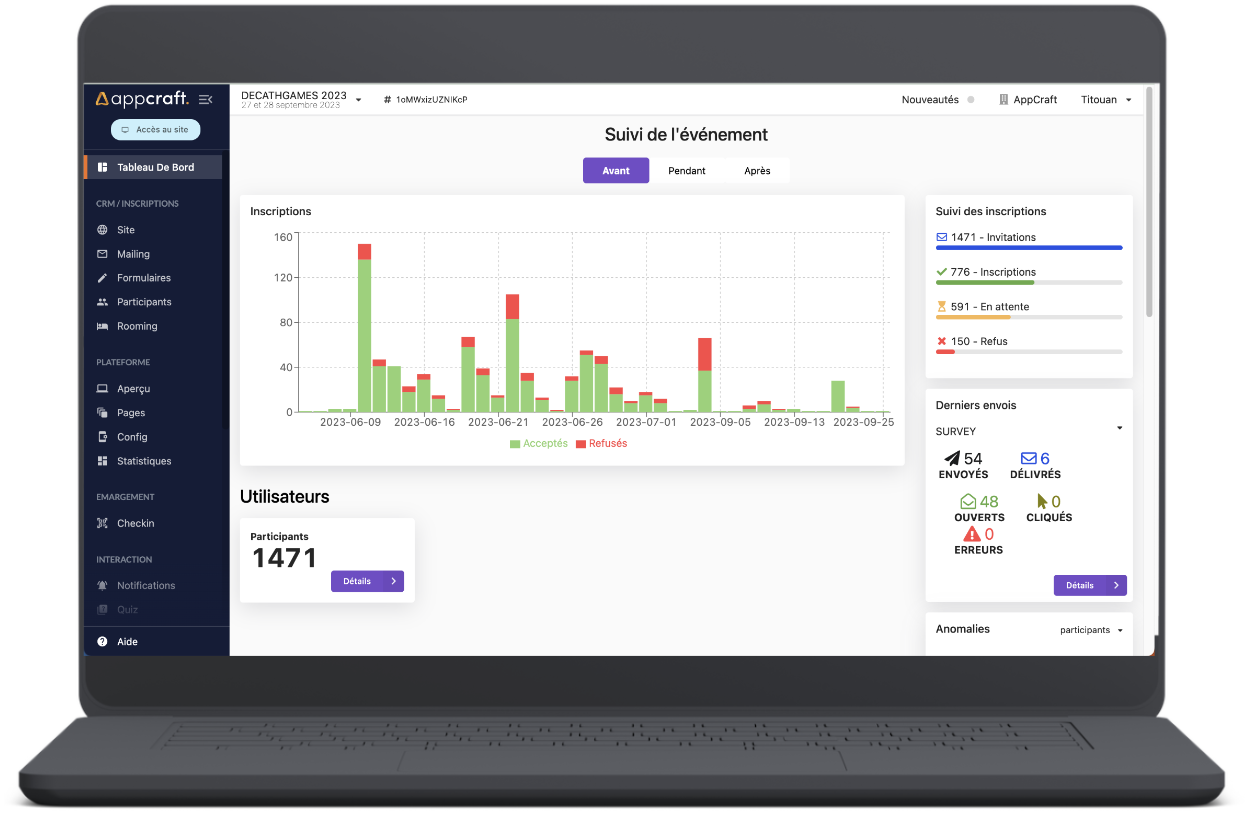
Every event manager has their own key performance indicators (KPIs). With SmartHub, you don't have to settle for standard graphs: you can build your own comprehensive dashboard. Aggregate registration, attendance, and mobile engagement data on a single screen to get a 360° view of your event's health at a glance.

View data in real time and track key performance indicators (KPIs)

Keep track of your events at a glance

Clear, intuitive overview: see how your events evolve in real time.

Key performance indicator (KPI) tracking: stay in control of every important metric.

Learn more

Informed decisions: optimize your organization and maximize the impact of your event.

Strategic steering: anticipate needs and adjust your actions for guaranteed success.

  • AppCraft designed its event statistics module to give a complete, detailed view of every event. With this solution:
  • Track attendee interactions and engagement (polls, Q&A, group discussions).
  • Analyze traffic, downloads, and B2B meetings to optimize the experience.
  • Measure the effectiveness of registrations and email campaigns in real time.
Access your KPIs and improve your event decisions

Discover the real impact on participant engagement

Measure what really captures your audience's attention

Poll live: see your attendees' responses and trends in real time.

Analyze Q&A: understand which questions generate the most engagement.

Learn more

Follow group discussions: identify the topics your audience cares about.

Optimize interaction: adjust your content and activities to keep attention high throughout the event.

Analyze your attendees' engagement live

Analyze interactions throughout the event

Track all interactions to maximize the experience

Track every interaction and boost your attendees' experience

Real-time analysis: see the time spent on livestreams and the number of page views.

Learn more

Downloaded content tracking: identify which documents generate the most interest.

Meetings and networking: measure interactions between attendees and exhibitors.

Response rate and engagement: understand what works to improve the overall experience.

Maximize the impact of your event by adjusting your content and activities based on observed behavior.

Optimize your attendees' experience
Analyze interactions throughout the event

Measure the effectiveness of registrations and mailings

Improve your campaigns and conversion rates

Real-time tracking: instantly view your registration conversion rate.

Email analysis: track opens, clicks, and interactions to understand what works.

Learn more

Identify areas for improvement: adjust your campaigns to maximize impact and engagement.

Boost your results: turn every email and registration into a tangible opportunity for your event.

Improve the effectiveness of your event marketing campaigns

Live collaboration and sharing

Real-time shared dashboard(s) (View or Edit).

Streamline logistics with your vendors and your client reporting.

It's the end of "Listing_Final_v12.xlsx" files sent by email.

Learn more

Create specific views (e.g., list of train arrivals, list of dietary requirements) and generate a secure web link to share with third parties (drivers, hotels, caterers). These lists are updated in real time.

When sharing a report, you can set certain columns as "editable." For example, allow your travel agency to enter train ticket numbers directly into your participant database, or allow the hotel to validate check-ins, or allow the driver to check "passenger picked up" for perfect operational tracking.

Your service provider or client can securely access real-time data without needing an administrator account on the event management platform. It’s a true collaborative tool that eliminates back-and-forth emails and data entry errors.

For events with an invitation and guest system, AppCraft now offers an "Inviter / Invitee" reporting mode.

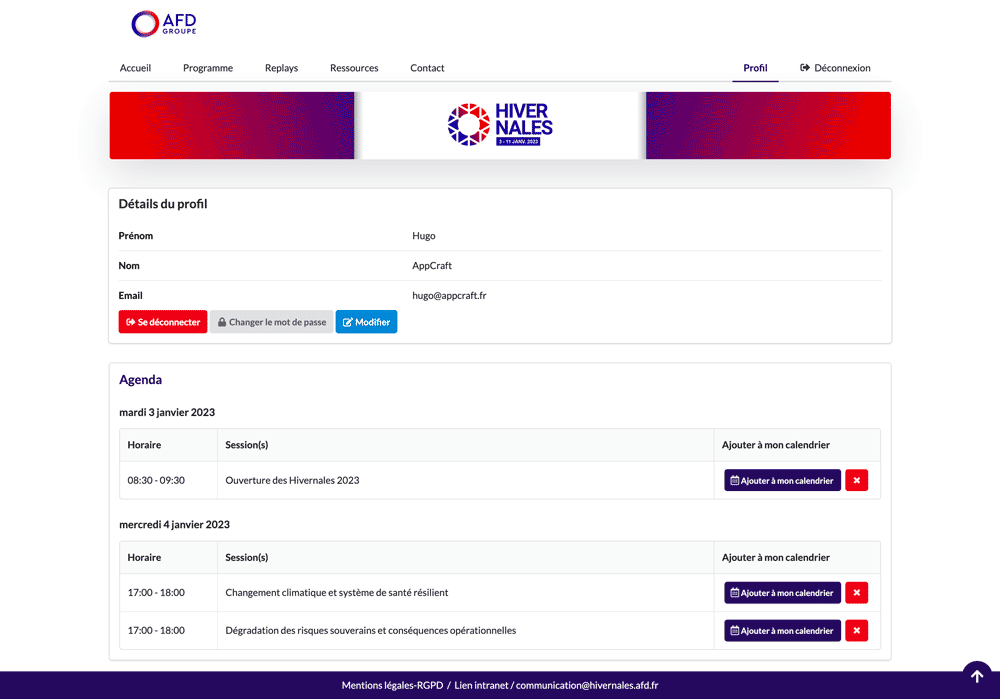
Each inviter only sees the people they invited

The report is accessible through a unique link secured by OTP

The link is built directly into the registration confirmation email

Columns are standardized for all inviters

Data is dynamic and updated automatically

This module is currently connected to the guest module.

  • In-depth analysis: generate custom reports tailored to your needs.
  • Draw valuable insights to optimize your event strategies.
  • Make informed decisions and maximize the impact of each of your events.
  • and if it's really necessary, easily export your data to Excel, Google Analytics, or your favorite tools.
Secure your data and optimize your event decisions
With our SmartHub, you see your event's performance live (registrations, attendance, engagement). Better still: create and share custom views for your clients or operations teams, accessible through a simple secure link and always up to date.

Security and Compliance

Password protection and GDPR compliance.

The ease of sharing must not compromise the security of personal data.

Each shared report is secured by OTP (One-Time Password).

Learn more

An additional password can be configured, as well as an expiration date for the link.

By selecting only the columns your contact needs (data minimization), you fully comply with GDPR principles and avoid sending complete files full of unnecessary sensitive information to the external vendors you work with.

In addition, access is individualized: each user only sees the data that concerns them (e.g., host/guests).

Furthermore, by selecting only the columns necessary for your contact (data minimization), you are fully complying with the principles of the GDPR.

FAQ: How to Measure Performance and Make the Most of Your Event Statistics?

What key performance indicators (KPIs) should you track to measure the success of a professional event?

An event’s performance metrics depend on its objectives. For a conference, these might include attendance rates, survey responses, and interactions. For a trade show, B2B meetings and leads generated may be more relevant.

AppCraft allows you to consolidate data from registrations, check-ins, email campaigns, and engagement tools into customized dashboards. This enables organizers to select the metrics that align with their goals and track their progress from a single interface.

How can you track event statistics in real time and adjust your planning accordingly?

Monitoring statistics in real time makes it possible to quickly identify discrepancies between expected results and actual participation.

For example, an organizer can monitor participant check-ins, identify low turnout for certain activities, or analyze survey responses during a conference.

The AppCraft SmartHub centralizes this information in a customizable dashboard. Teams can review the available metrics and adjust their actions while there’s still time, without waiting for the post-event analysis.

How can we share event data with clients and service providers without creating a multitude of Excel files?

To share event data effectively, it is best to use up-to-date reports rather than regularly sending new versions of Excel files.

The SmartHub AppCraft allows you to create custom views and share them using links secured with one-time passwords (OTPs). Reports update automatically, and certain columns can be made editable.

For example, a hotel can update accommodation information, while a carrier can view its passenger list. Each service provider has access only to the information necessary for its specific task.

How Can You Measure an Event's ROI Using Statistics?

To measure the return on investment (ROI) of an event, you must compare the results achieved with the objectives and the costs incurred. The metrics vary depending on the event format: number of attendees, business leads generated, B2B meetings, engagement, or satisfaction.

AppCraft allows you to collect and centralize much of this data through its registration, networking, and interactive modules.

However, event statistics alone are not always sufficient to calculate the financial ROI. It may be necessary to supplement them with the actual costs of the event and the business benefits measured after the event.

How do you choose event reporting software that's right for your organization?

Event reporting software should be selected based on the data to be analyzed, collaboration needs, and the customization options for dashboards.

For a simple event, a spreadsheet may be sufficient. For a convention, conference, or event involving multiple service providers, an integrated platform makes it easier to track and share information.

AppCraft offers a SmartHub that lets you create custom dashboards, share dynamic reports, and export data to other tools. Sharing links can be protected by a one-time password (OTP), with access rights tailored to each recipient.

Ready to save time on your next events?

Join the 1,500+ event planners already running their B2B events with AppCraft.

Free personalized demo · Reply within 24 hours