
Basic Sheet 13 / 68
Statistics and KPIs for your event
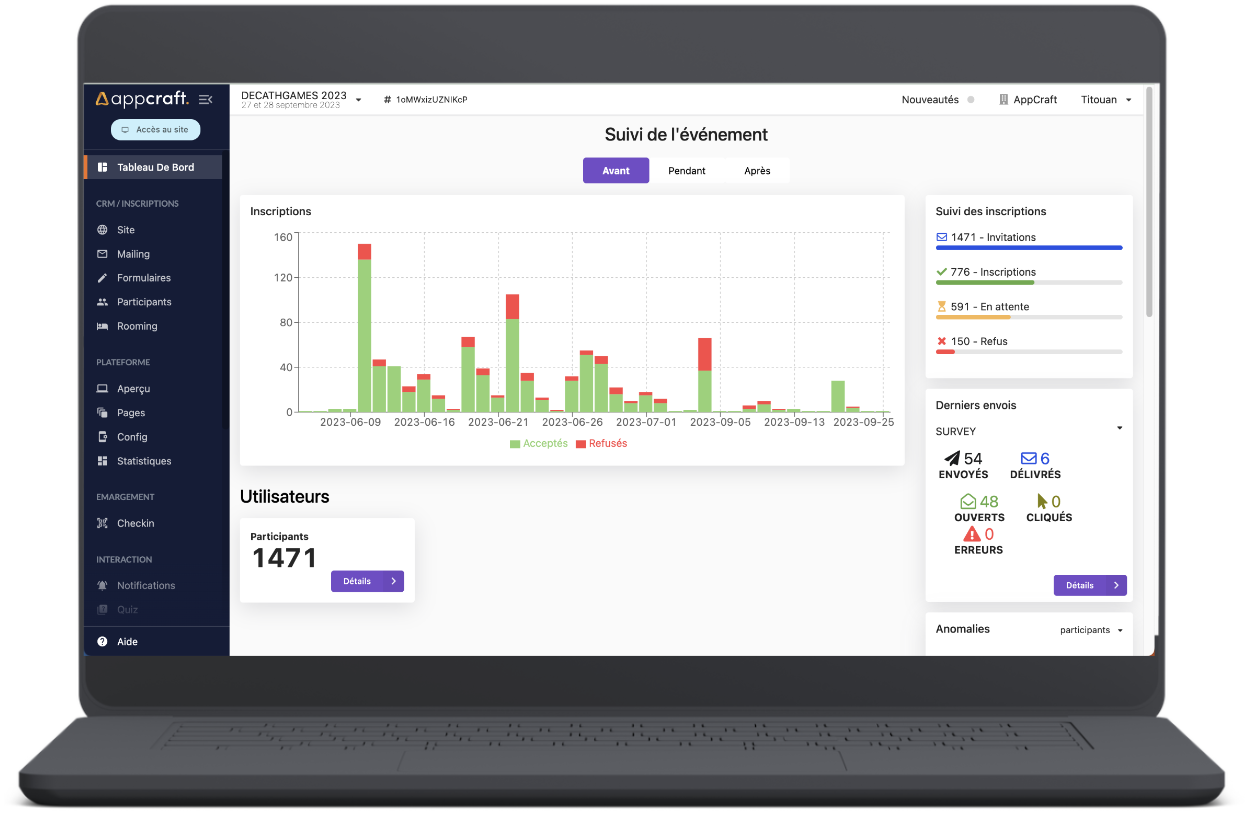
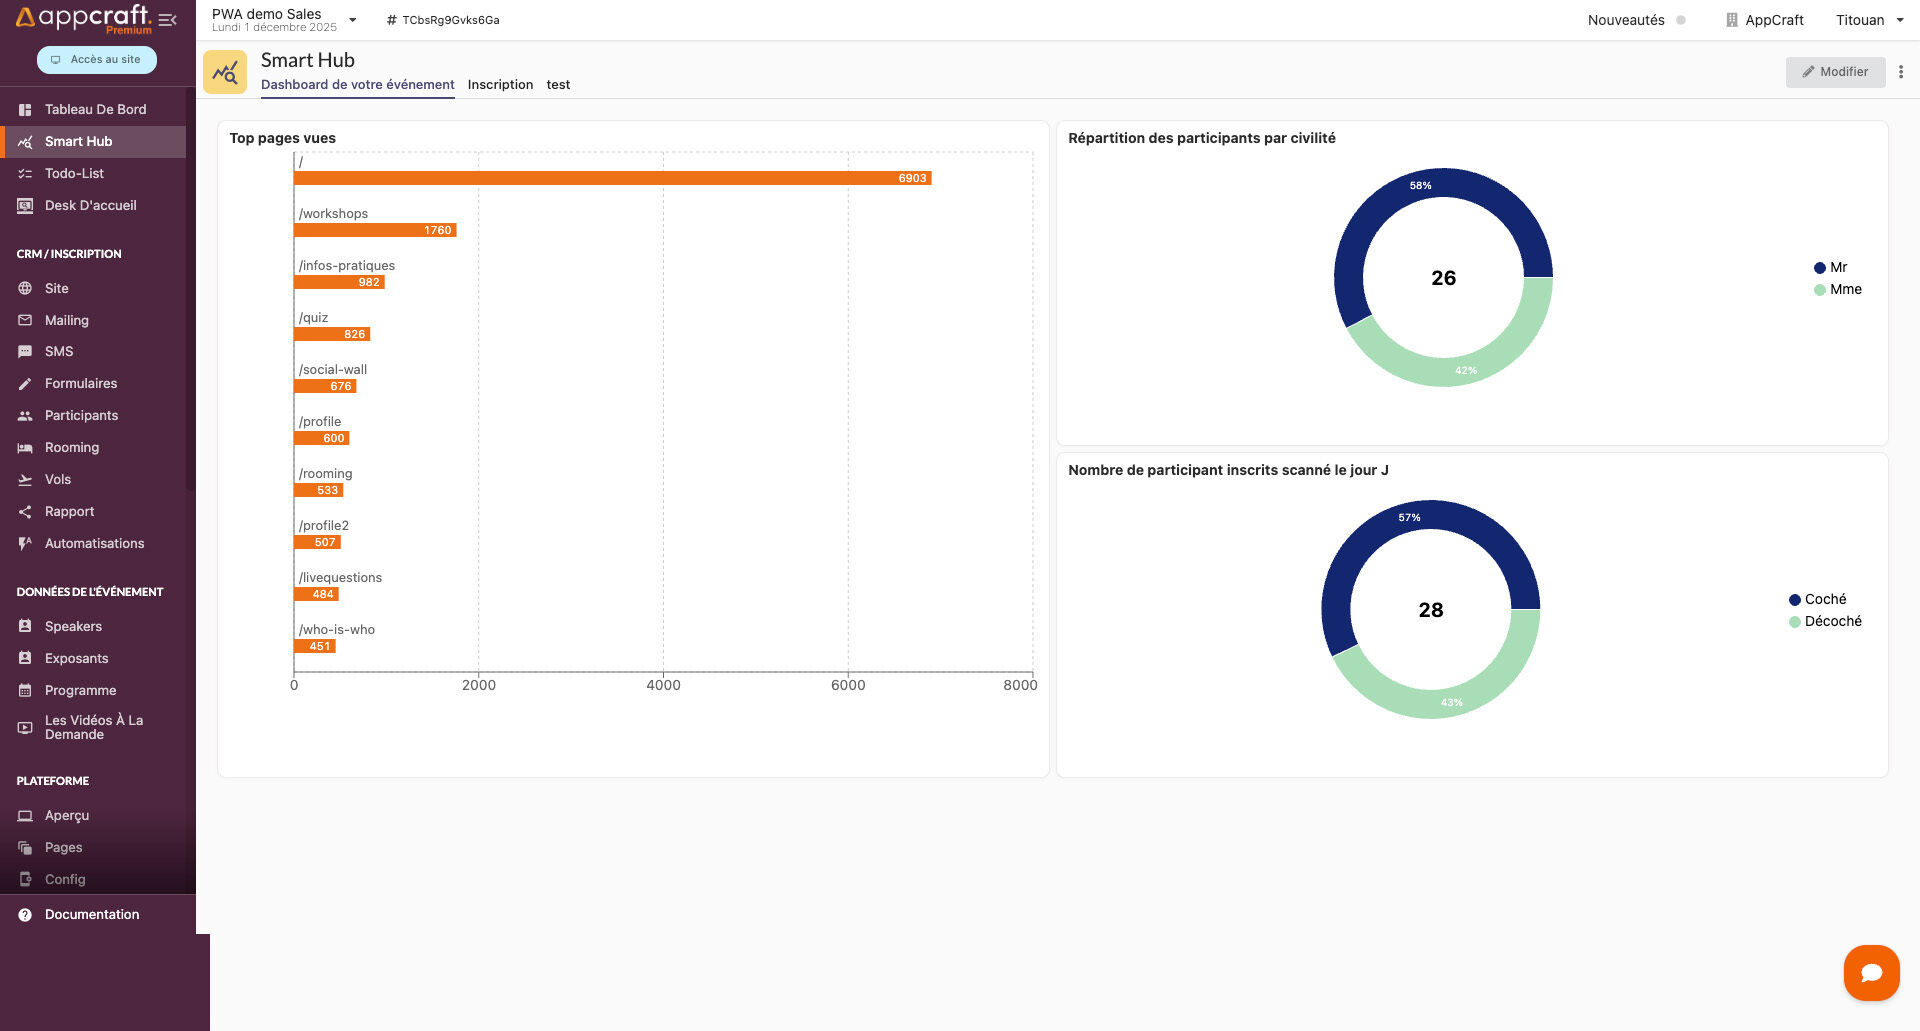
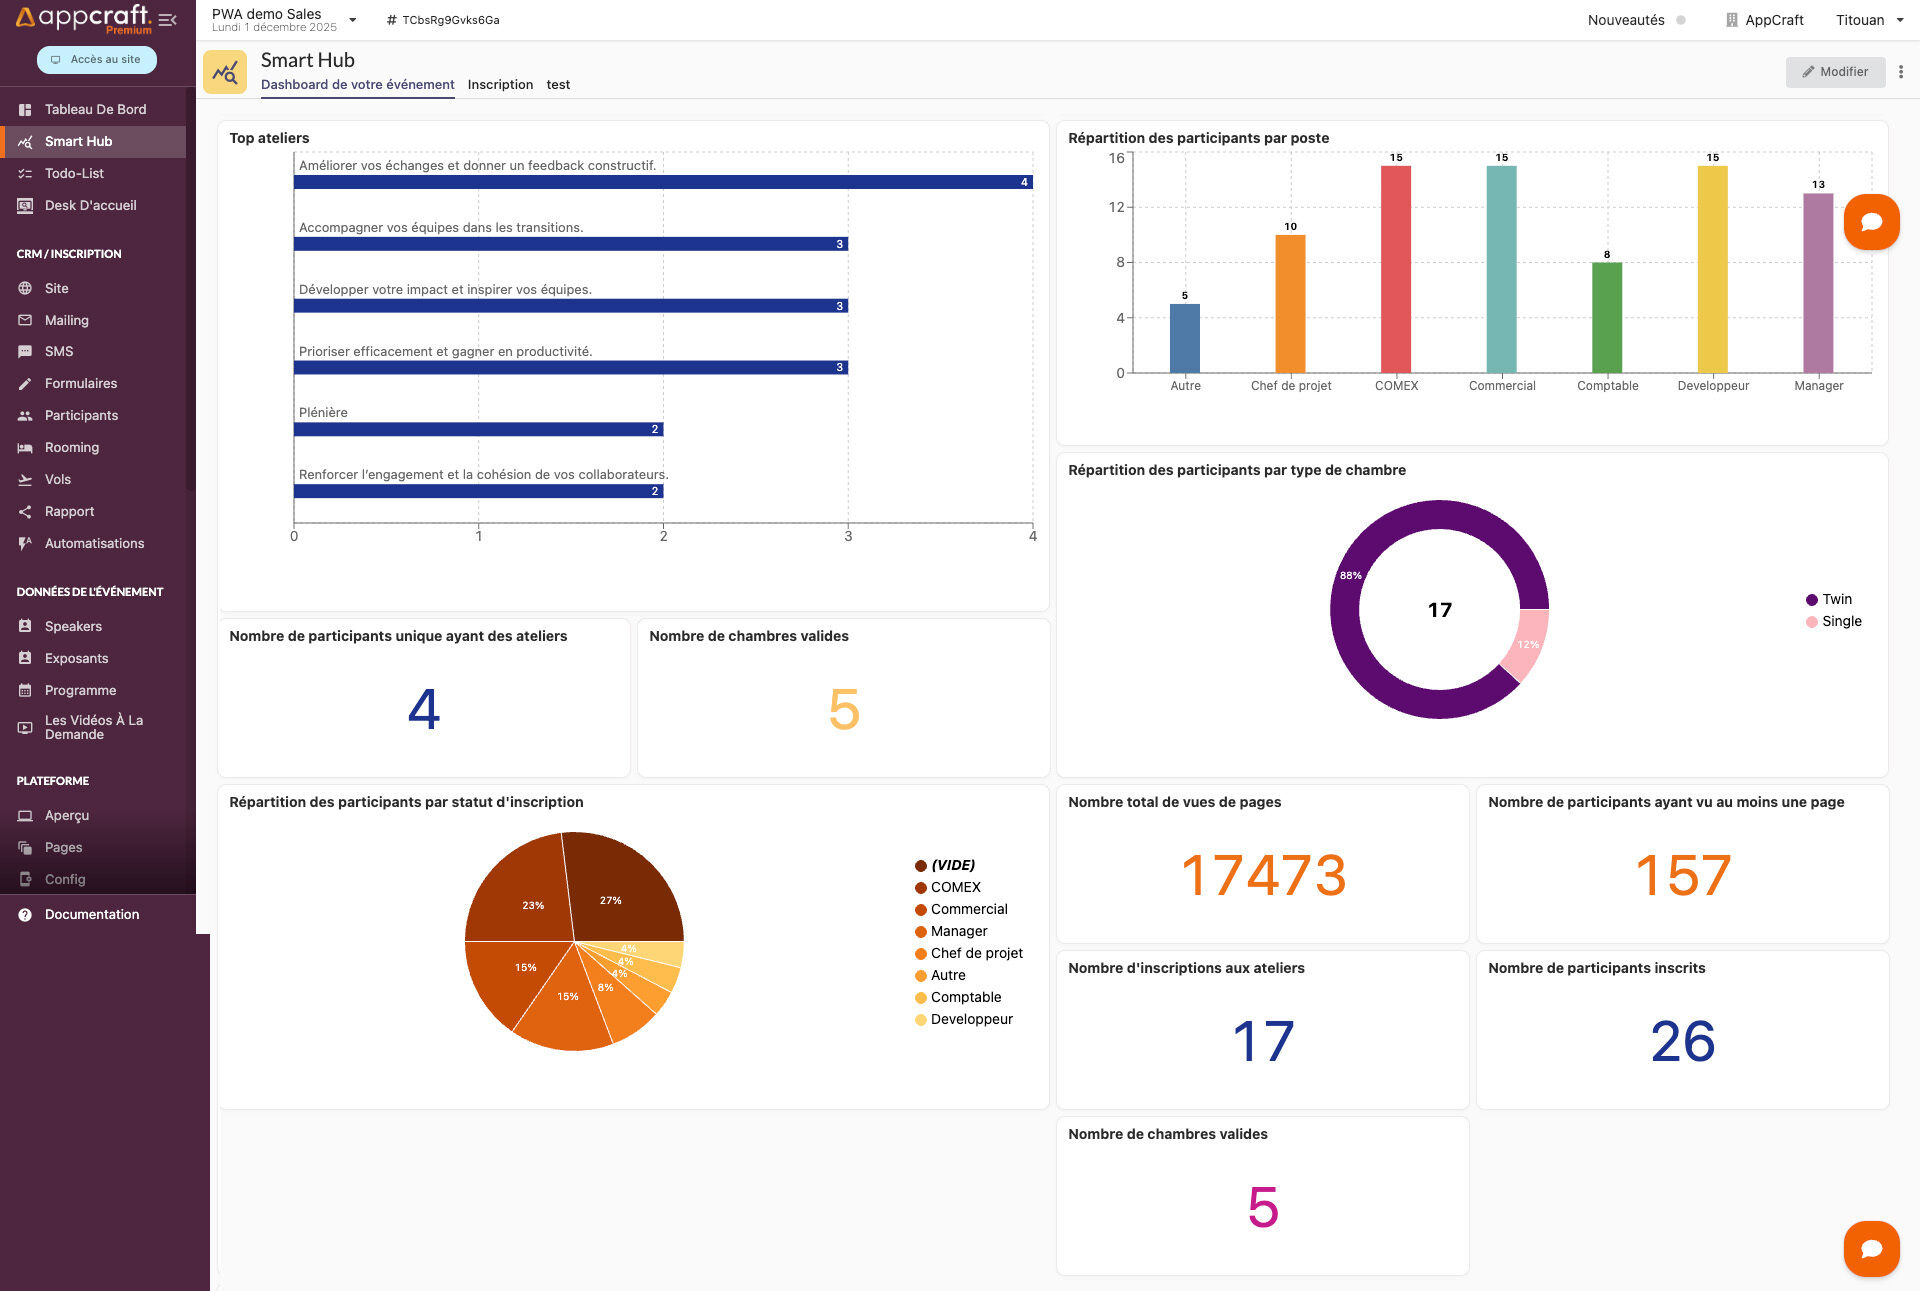
Analyze your event's performance in real time: live audience, downloads, registrations, customized statistics for accurate KPI tracking.
Quote line: Statistics
Statistics
Visual example
Statistics
Visual example
Statistics
Visual example
Mailing
- Email open rate
- Link click rate (e.g., registration, agenda). Depends on the mail server
- Number of undelivered emails (errors, invalid addresses)
- Number of people who received reminders
Check-in and event access
- Number of attendees present vs. registered (no-show rate)
- Attendee arrival times (peak attendance)
- Entries by access point (different venues, rooms)
- Number of people per workshop
Networking
- Number of connections and exchanges between attendees
- Number of messages exchanged through the platform
- Number of confirmed meeting requests
Web platform and mobile app with LOGIN + PASSWORD access
- Number of app logins
- Number of native app downloads
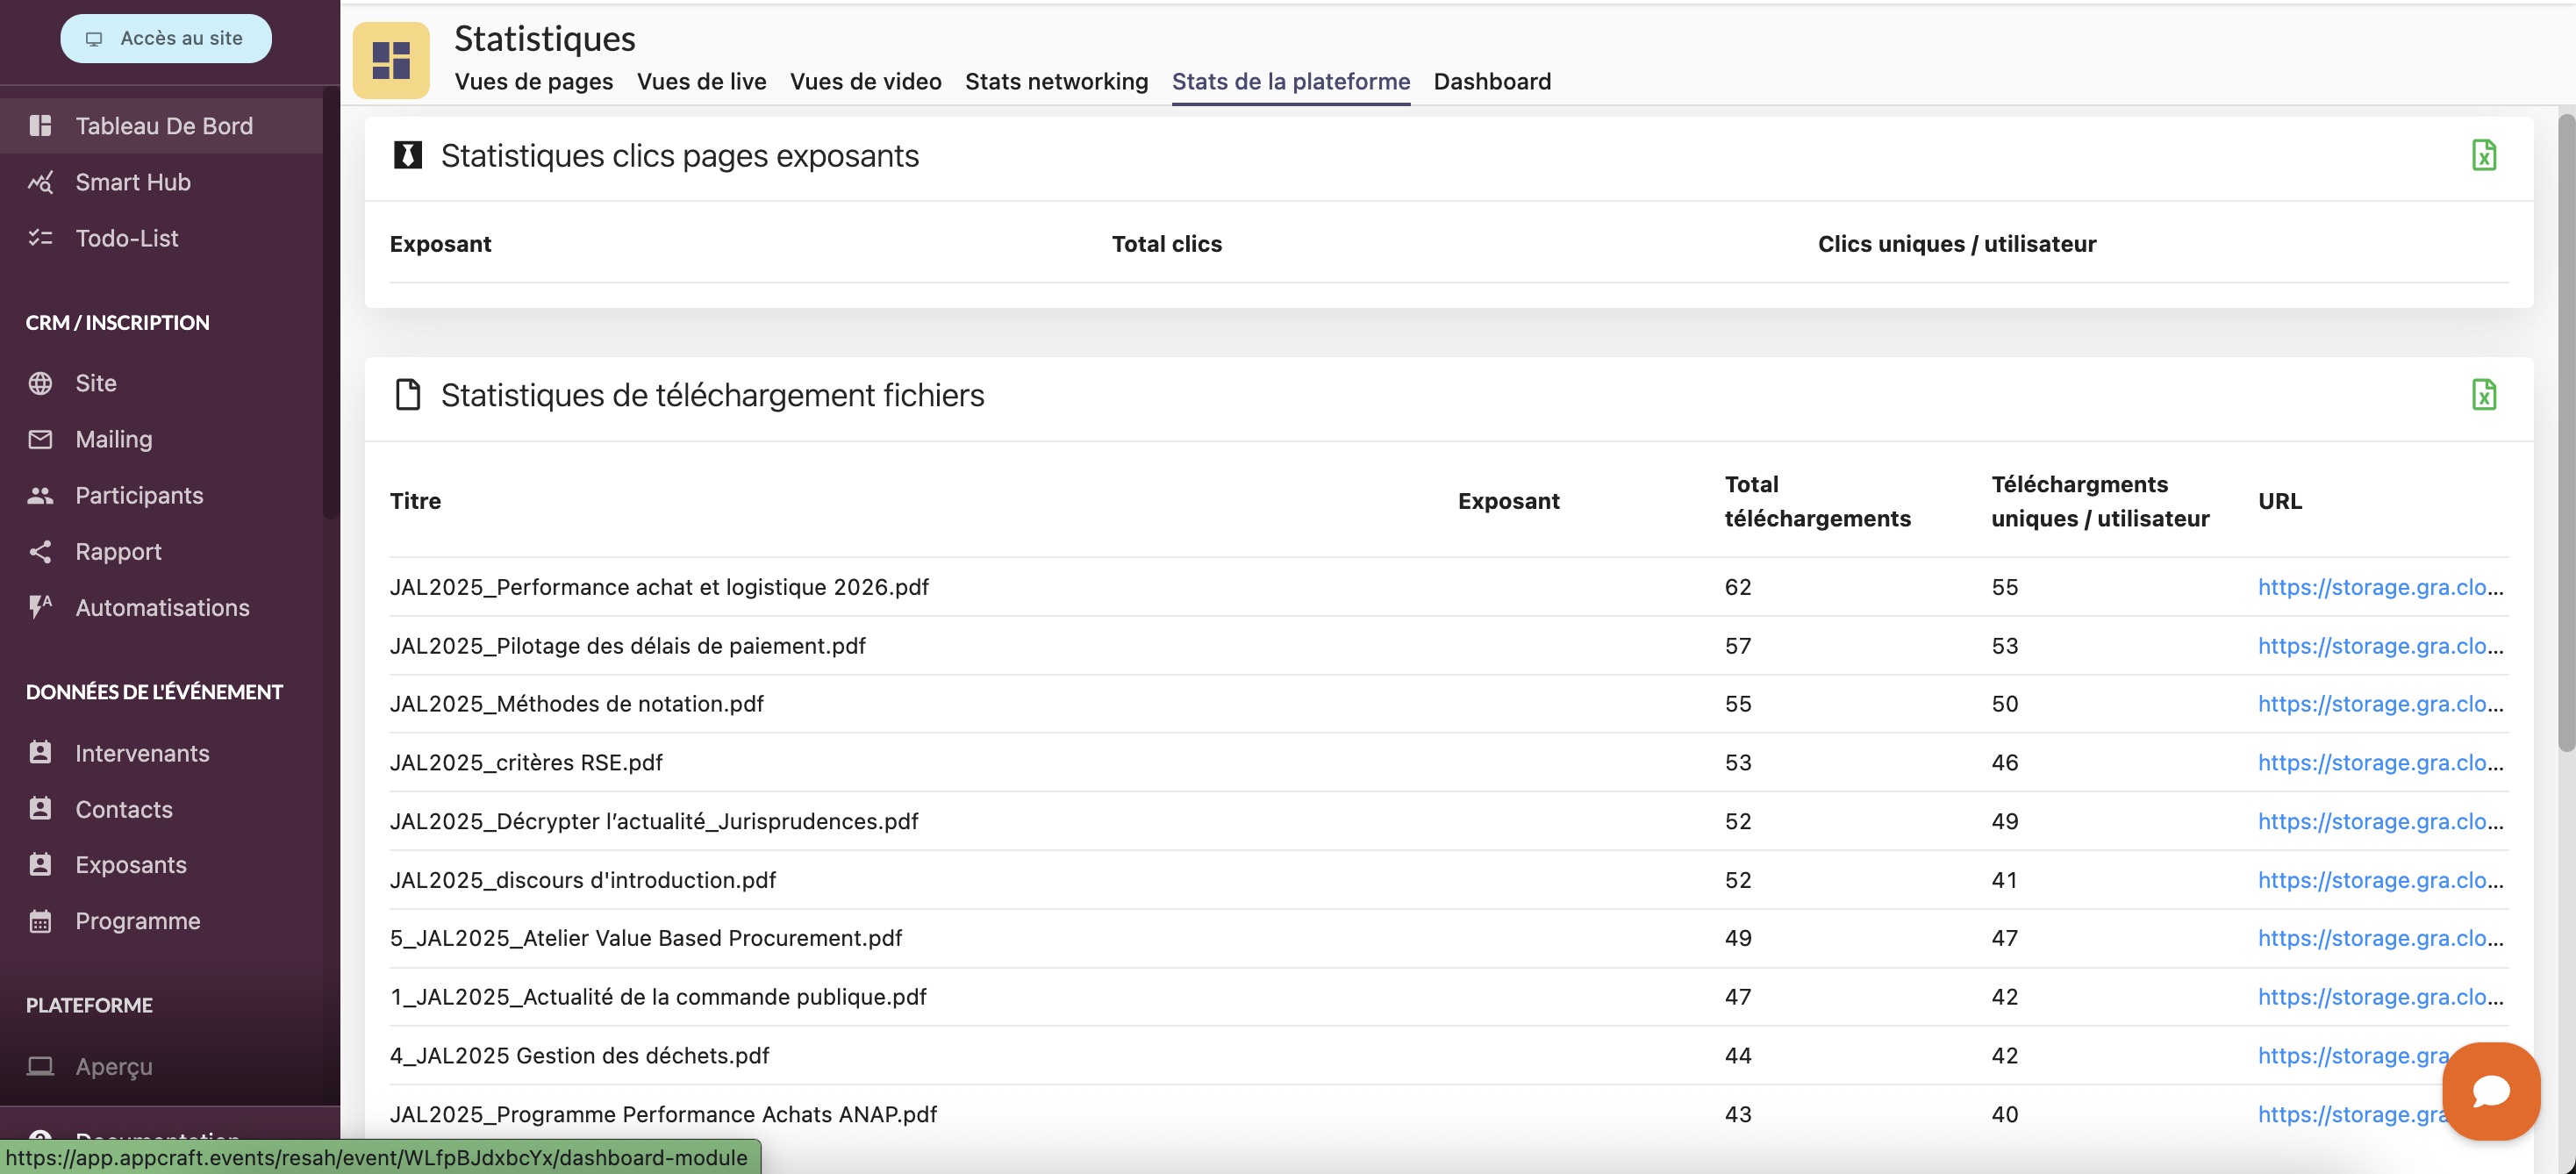
- Number of views for each page
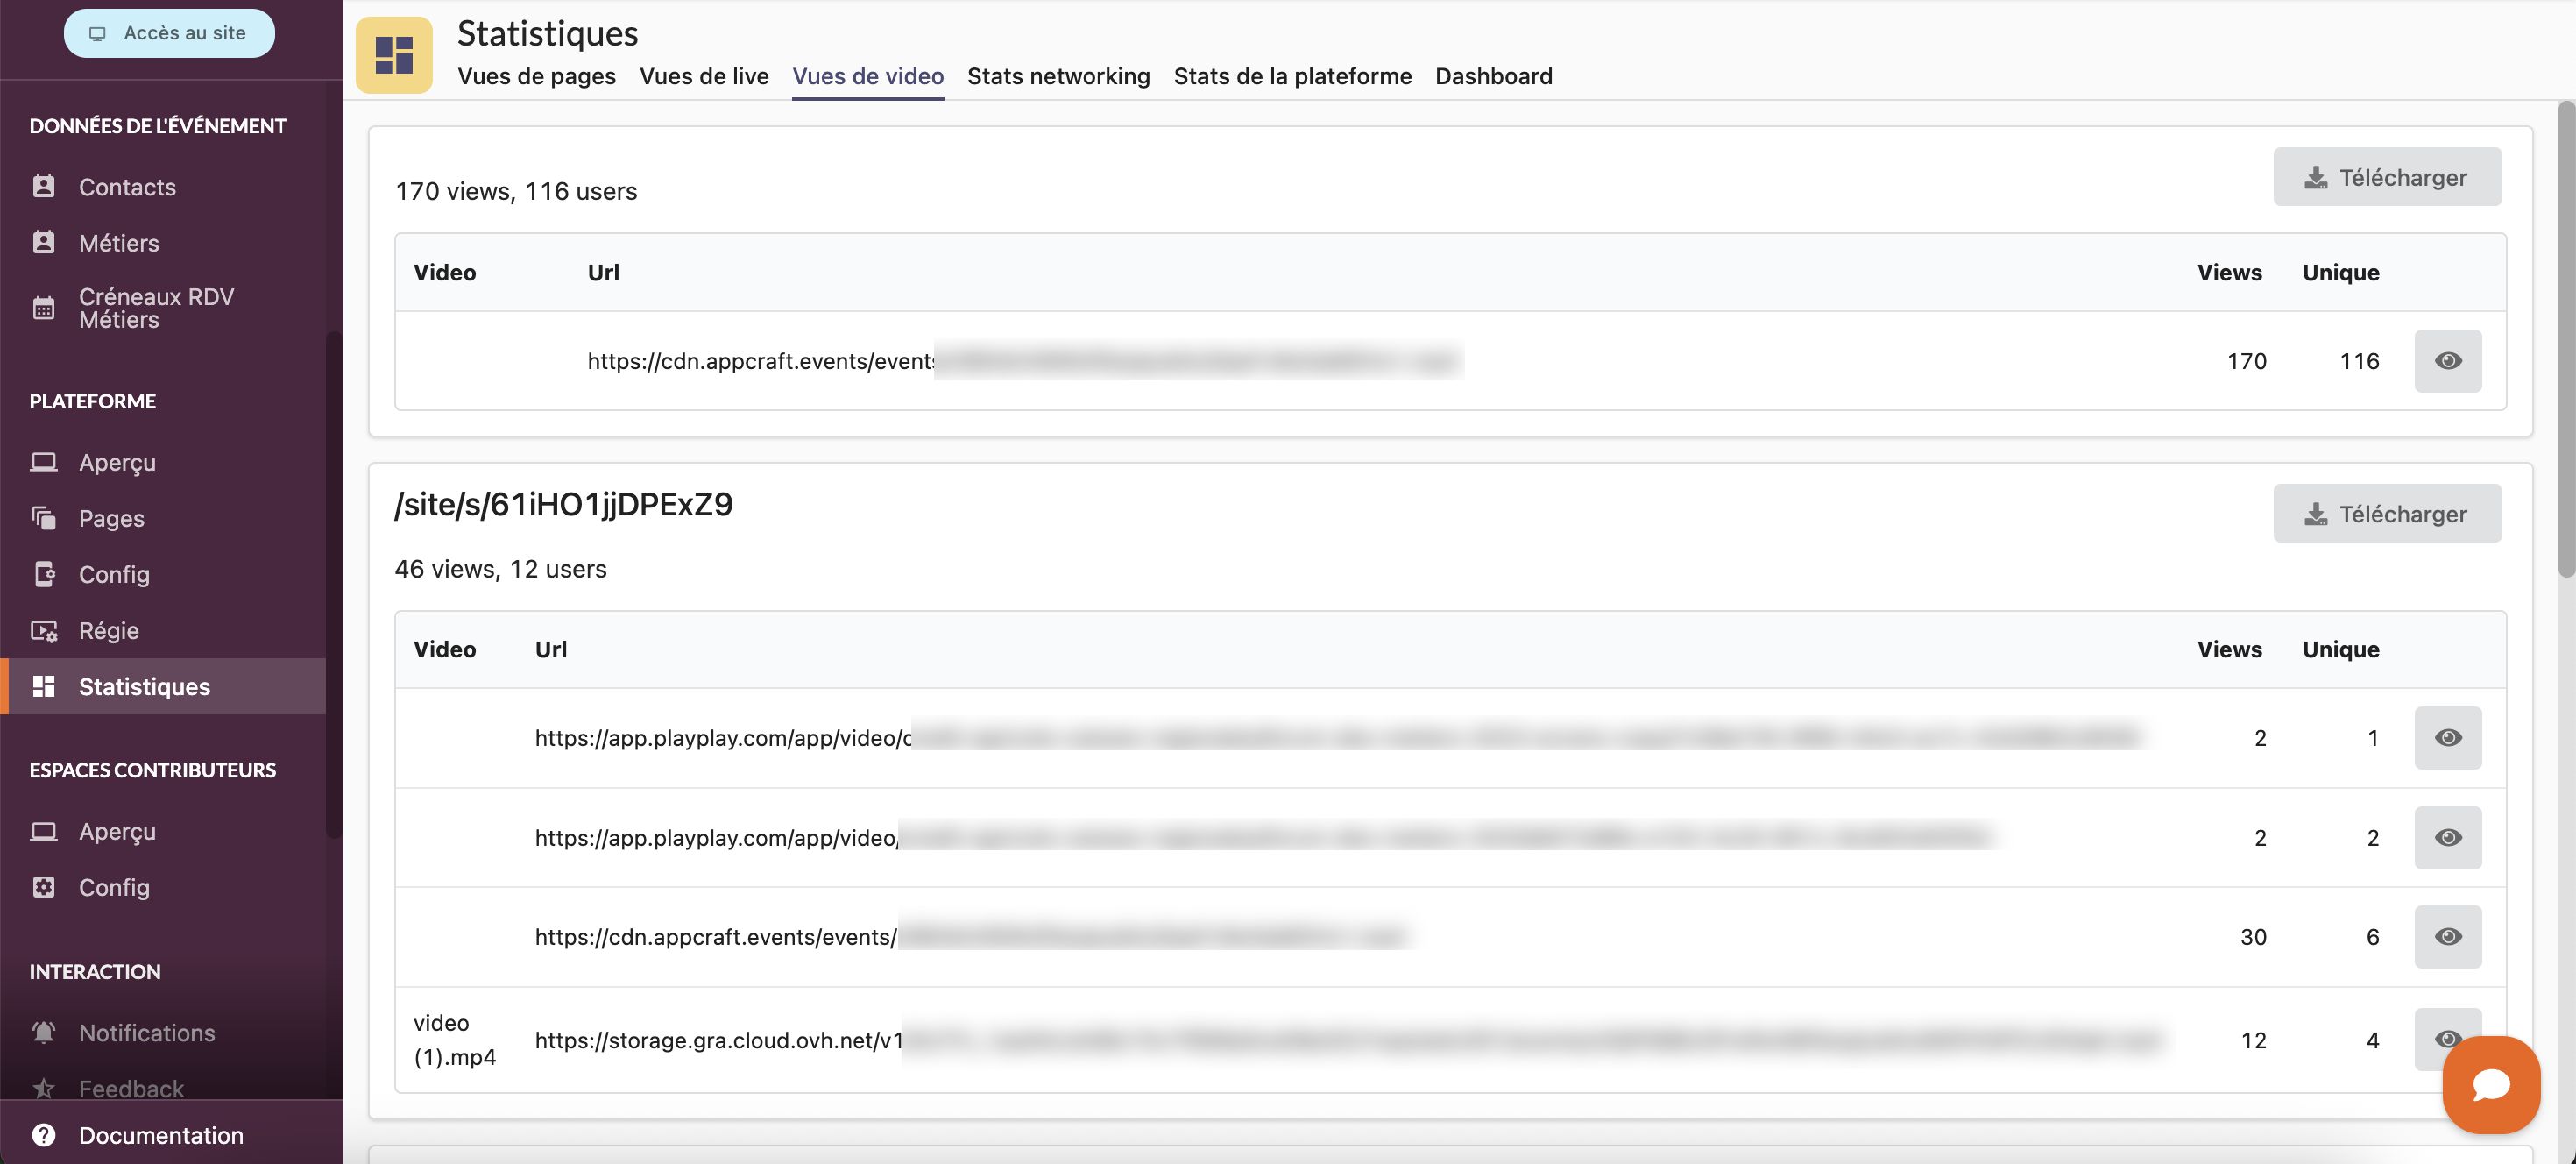
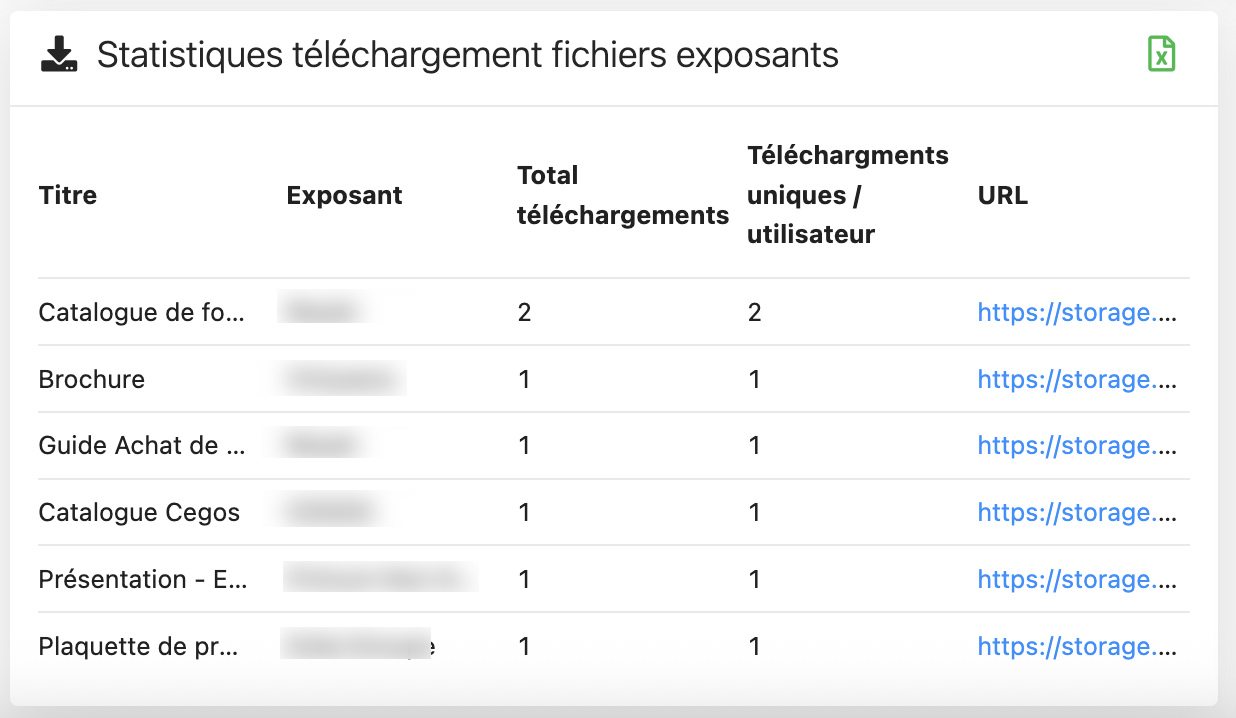
- Number of times files were downloaded / videos were viewed
- Most-used features (agenda, networking, notifications)
- Number of push notifications sent
Livestreaming
- People who logged in and attended the livestream(s) and replay
- Audience curve (viewers over time)
- Attendee viewing time during the livestream
- People who logged in and registered for the livestream and/or replay
Satisfaction survey
- Post-event survey response rate
- Overall satisfaction score
- Analysis of open-ended responses and key trends
Exhibitor
- Number of page views
- Number of file downloads
- Number of video views
- Number of clicks on the links on the exhibitor's page
- Number of people scanning and scanned per exhibitor
- List of scanned people with their information
Meeting booking
- Number of meetings booked and meeting show/no-show
- Sponsors page: views / unique views per sponsor
The benefits of effective participant management
- The platform gives administrators secure, robust access to manage and organize every aspect of the event
- Enables efficient, centralized management of all event-related activities
- The back office ensures that each attendee receives the relevant information suited to their profile, improving the user experience
- Makes it easier to evaluate ROI and KPIs
- Lets you track performance and results in real time
Access to the platform for managing and organizing your events: the back office.
Mini-site
- To get statistics, you can connect your Google Analytics
Form
- Number of registrations per day
- Attendee breakdown by category (job title, company, brand, region…)
- Registration sources (if UTM links are used)
- Statistics on workshop, activity and option choices